
Crowd Forecast News Report #341
[AD] PDF: 7 Risk Management StrategiesThe new TimingResearch report for the week has been posted, you can download the full PDF report with the link below or you can read the full report in this post below.
Click here to download report in PDF format: TRReport040520.pdf
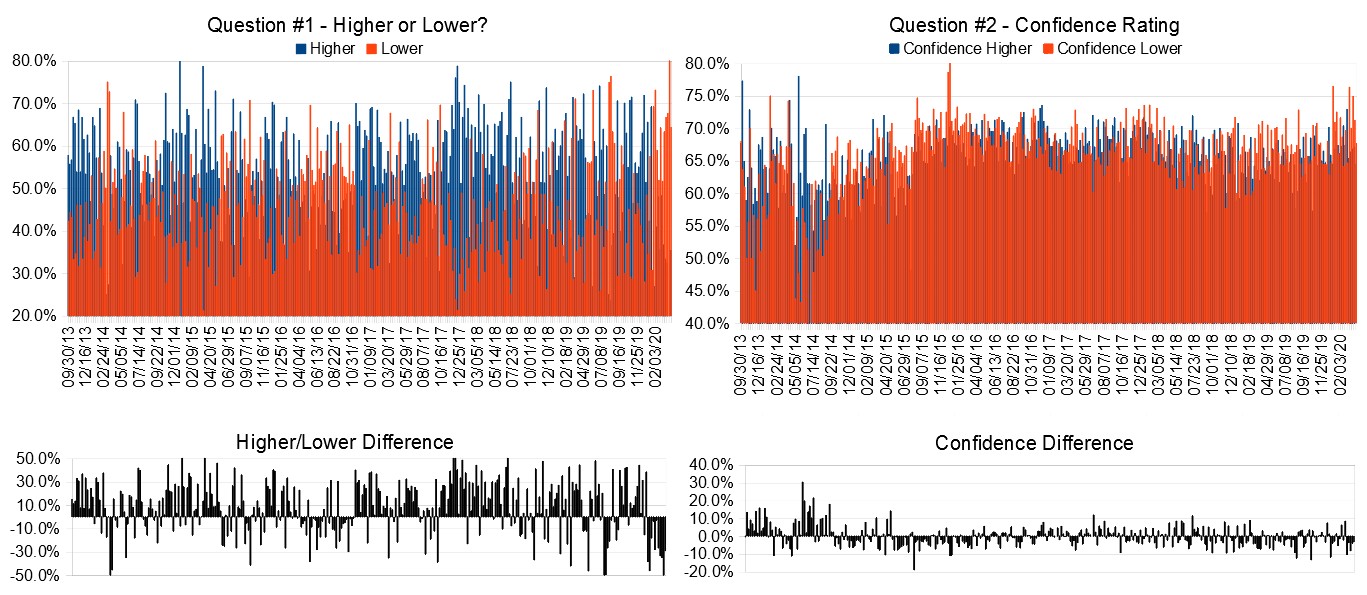
Question #1. Which direction do you think the S&P500 index will move from this coming Monday’s open to Friday’s close (April 6th to 10th)?
Higher: 35.5%
Lower: 64.5%
Higher/Lower Difference: -29.0%
Question #2. Rate your confidence in your answer to Question #2 by estimating the probability you have correctly predicted next week’s market move.
Average of All Responses: 66.6%
Average For “Higher” Responses: 64.6%
Average For “Lower” Responses: 67.8%
Higher/Lower Difference: -3.2%
Responses Submitted This Week: 31
52-Week Average Number of Responses: 31.8
TimingResearch Crowd Forecast Prediction: 57% Chance Higher
This prediction is an attempt by the editor of this newsletter to use the full 6+ year history of data collected from this project to forecast a probability estimate for whether this week’s sentiment is going to be correct and ultimately what the markets will do this coming week.
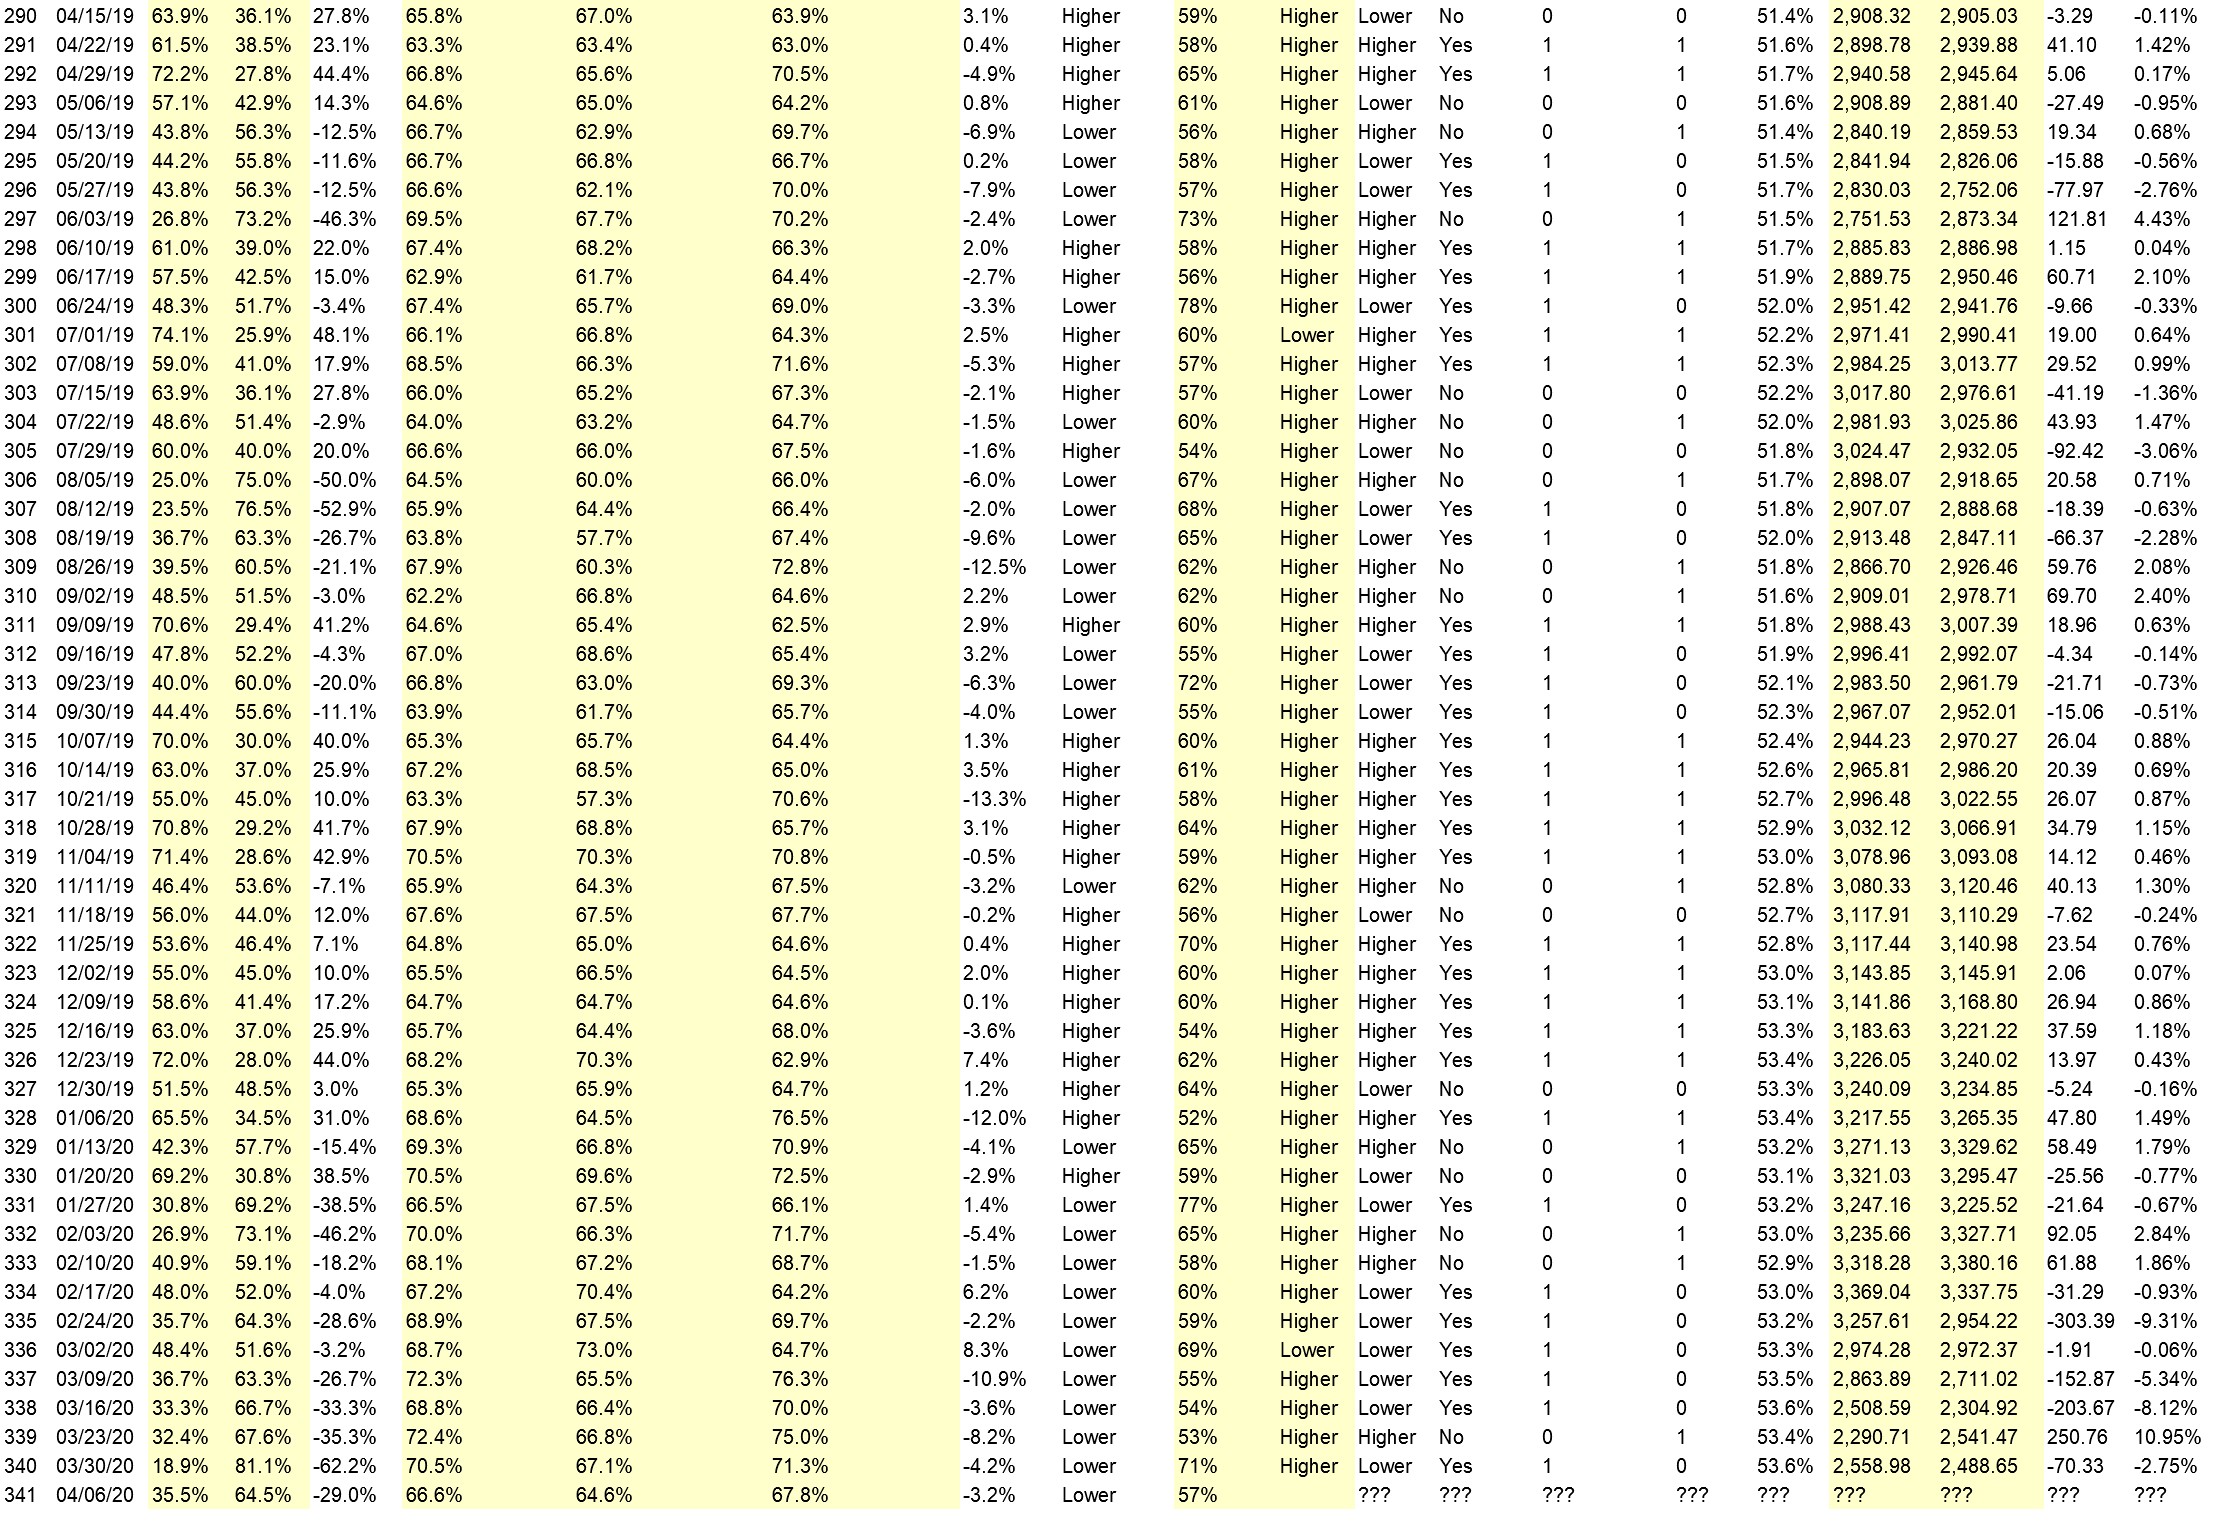
Details: Last week’s majority sentiment from the survey was 81.1% predicting Lower, and the Crowd Forecast Indicator prediction was 71% chance Higher; the S&P500 closed 2.75% Lower for the week. This week’s majority sentiment from the survey is 64.5% predicting Lower with a greater average confidence from those who are predicting Lower. Similar conditions have occurred 28 times in the previous 340 weeks, with the majority sentiment (Lower) being correct 43% of the time and with an average S&P500 move of 0.10% Lower for the week. Based on that history, the TimingResearch Crowd Forecast Indicator is forecasting a 57% Chance that the S&P500 is going to move Higher this coming week.
Raw Data Page (raw data files include full history spreadsheet and the above charts):
TimingResearch.com/data.
[AD] PDF: 7 Risk Management Strategies
Full Weekly Results (full version of this chart available in the raw data spreadsheet for this week, “Date” field below lists the Monday of the week being predicted).
Overall Sentiment All-Time “Correct” Percentage: 53.6%
Overall Sentiment 52-Week “Correct” Percentage: 64.7%
Overall Sentiment 12-Week “Correct” Percentage: 63.6%
Only the previous 52 weeks of data are shown below, please download the raw data to see the full range of past data.
Weekly Reports Page: TimingResearch.com/reports
Raw Data Page: TimingResearch.com/rawdata
Current Survey Page: TimingResearch.com/currentsurvey
Any feedback: TimingResearch.com/contact
Email Alerts
Make sure you don’t miss all the future reports, show reminders, and bonus offers from TimingResearch, enter your best email here:
By signing up you agree to receive newsletter and marketing emails. You can unsubscribe at any time.
Privacy Policies
NOTE: The following open-ended answers are solely the opinions of the anonymous respondents to this survey. Responses are mostly unedited, but some have been reformatted slightly for to make them easier to read. Some irrelevant responses (e.g. “none”), or anything obviously fake, or copy and pasted responses have been omitted. All-caps responses have been changed to all lowercase. All responses for each week, unedited, are available in the raw data spreadsheets at TimingResearch.com/data.
Question #3. For your answer to Question #1, please share what specific reason(s) you think the S&P500 will be heading the direction you chose.
“Higher” Respondent Answers:
• Moved up after touching support
• When I say lower, it goes higher so I think it will go higher.
• the corona rate is begining to flaten out
• The OPEC oil issue will probably be worked out, which the market will like this week. Unemployment, debt, bankruptcies are big issues, but may hold off for another time to do their damage.
• because it dropped by more than 20% this week, there for a its due for a correction upwards but then it will drop a lot more mid week onwards
• The chines will have no choice but let it go to fix
“Lower” Respondent Answers:
• in a depression
• Fib retracement
• we are losing the battle with the virus
• The economy shut down.
• because there is a possible Head and shoulder pattern in the weekly chart
• People are trading in fear. This is a good time to find buys with many stocks bottomed out.
• Well, maybe the China Flue numbers growth in USA..
• accelerating corona cases
• Continued coronavirus bad news
• Curves are gradually flattening.
• too many companies shut down, too many people are out of work
• Most of the financial information shows greater negativity each week of this “stay in place” order.
• Can’t see direction but bias toward down.
• It is too early to say the market S&P 500 has hit a bottom. Who knows what Trump will say next?
• Trend is still down
[AD] PDF: 7 Risk Management Strategies
Question #4. What procedures do you use to monitor and evaluate your trading results and progress over time?
• bottom line number
• i use advanced trading software
• look at charts, and indexes
• I enter the “history” of each stock periodically to see how I’m doing. On a daily basis I compare my accounts with the results of the major markets–was I higher or lower then they are?
• Gains and losses
• I write down my trades in an excel spreadsheet
• Normal market TSE
• Spreadsheet
• I use excell spreadsheet..
• several
• Analyzing Moving Averages and On Balance Volume
• I am a Stockcharts subscriber and have investments with TD Webbroker . I watch the market a;; day.
• p&L
Question #5. Additional Comments/Questions/Suggestions?
• what is your predictions?
• the 900 point drop after the stimulis was a pie in the face
• Don’t scare so many of popple
• Thankful for this platform. I value everyone’s opinion. God Bless Canada and USA!!